La plateforme de Géoindicateurs pour
en apprendre plus sur vos visiteurs
générer rapidement des études de marché
planifier le développement urbain
comparer vos parts de marché
prévoir l'achalandage en magasin
analyser les déplacement

Transforming Mobile Location Data into Privacy-Compliant Business Insights
Actionable insights to drive performance
Cross-Visits Report
Understand how visitors move between multiple locations and identify key connections between brands, attractions, and points of interest. Our cross-visit reports help you detect partnership opportunities, refine your marketing targeting, and gain deeper insights into consumer behavior.
Our analysis enables you to:
- Identify shared visitors across multiple sites, measuring the attractiveness and synergy between different locations.
- Analyze movement trends between brands, businesses, or competing locations, providing a clearer picture of consumer habits.
- Detect collaboration and co-marketing opportunities by recognizing complementary brands or venues.
- Optimize your location strategy by pinpointing areas where visitors frequently interact with other key locations.
- Enhance your marketing campaigns by targeting consumers who visit multiple relevant sites within your market.
With data-driven insights, make informed strategic decisions and maximize the potential of cross-visitation patterns.

Territorial Coverage
Available for Canada and the United States.
Duration (min. - max.)
3 to 12 months
Sample Size
250 - 300 000 devices

Area coverage
100 meter² to 10 km² (From 1,076.4 ft² to 107,639,104²)

Before & After Report
Analyze how visitor behavior evolves following a strategic change and adjust your actions accordingly. Our before & after reports allow you to measure the impact of openings, closures, events, or marketing campaigns on foot traffic and consumer habits.
Our analysis enables you to:
- Identify locations visited before and after an action, to assess its impact on the customer journey.
- Compare foot traffic across nationally recognized points of interest (POIs), categorized by type, brand, and location.
- Observe changes in visitor habits, such as shifts towards competitors or emerging trends.
- Measure the effectiveness of a marketing campaign or loyalty program, by tracking variations in customer behavior.
- Optimize your commercial and location strategies, by adjusting your offering based on observed trends.
With these data-driven insights, make informed decisions and maximize the impact of your initiatives.
Territorial Coverage
Available for Canada and the United States.
Duration (min. - max.)
3 to 12 months
Sample Size
250 - 300 000 devices

Area coverage
100 meter² to 10 km² (From 1,076.4 ft² to 107,639,104²)
Quels sont les types de rapports?
Rapports des visites
Apprenez-en plus sur les visiteurs de n’importe quel lieu ciblé et leurs habitudes de consommation. Grâce aux rapports de visites, découvrez aussi :
- combien de temps durent les visites des lieux ciblés;
- le total des visites et sa répartition à travers le temps;
- le nombre de visites moyennes par personne;
- la provenance des visiteurs;
- les périodes d’achalandage les plus fortes;
- les prévisions de visites dans le temps.

Visits Report
Understand who visits a location, how often, and for how long. With our visit reports, access precise data to optimize your business strategies, refine your offerings, and better meet consumer expectations.
Our analysis enables you to:
- Measure average visit duration, a key indicator of visitor engagement and interest.
- Track visit volume and its evolution over time, helping you anticipate trends and adjust marketing efforts.
- Analyze visit frequency per person, distinguishing between regular customers and occasional visitors.
- Identify visitor origin to better understand consumer behavior and refine your advertising campaigns.
- Obtain visit forecasts, based on real data, to improve resource planning and enhance the customer experience.
With these data-driven insights, make informed strategic decisions and optimize the performance of your retail locations or public spaces.

Territorial Coverage
Available for Canada and the United States.
Duration (min. - max.)
3 to 12 months

Sample Size
250 - 300 000 devices

Area Coverage
100 meter² to 10 km² (From 1,076.4 ft² to 107,639,104 ft²)

Visits Market Share Report
Get a clear snapshot of your market share compared to competitors and identify key trends shaping your industry. Using real visitor data, gain valuable insights to refine your growth and expansion strategies.
Our analysis enables you to:
- Compare your performance with competitors, based on visit volume and visitor loyalty.
- Identify industry leaders and expansion opportunities in new markets.
- Analyze foot traffic trends, understanding demand shifts and consumer behavior.
- Adjust your marketing and sales strategies with concrete data on the attractiveness of your locations.
With accurate and up-to-date data, make informed decisions and strengthen your market position today!
Territorial Coverage
Available for Canada and the United States.
Duration (min. - max.)
3 to 12 months
Sample Size
250 - 300 000 devices

Area Coverage
100 meter² to 10 km² (From 1,076.4 ft² to 107,639,104²)
Tourism Report
Gain valuable insights into who visits a region, where tourists come from, and how their presence evolves over time.
Our analysis enables you to:
- Identify visitor origin – Tailor your promotional campaigns based on their geographic source.
- Distinguish between excursionists and tourists – Adapt your services and offerings according to their length of stay.
- Track visit trends – Detect seasonal patterns and measure the impact of major events.
- Analyze stay duration – Assess the attractiveness and retention capacity of your destination.
- Anticipate visitor volume – Plan ahead for resource and service needs.
With accurate, data-driven insights, refine your tourism strategies, enhance visitor experiences, and maximize the economic impact of your destination.

Territorial Coverage
Available for Canada and United States.
Duration (min. - max.)
3 to 12 months.
Sample Size
250 - 1 000 000 devices

Area Coverage
10 km² to 1 800 km² (From 161,458,656 ft² to 19,375,038,720 ft²)

Trails Report
Gain critical insights into trail usage patterns to better understand visitor behavior and enhance trail management.
Our analysis enables you to:
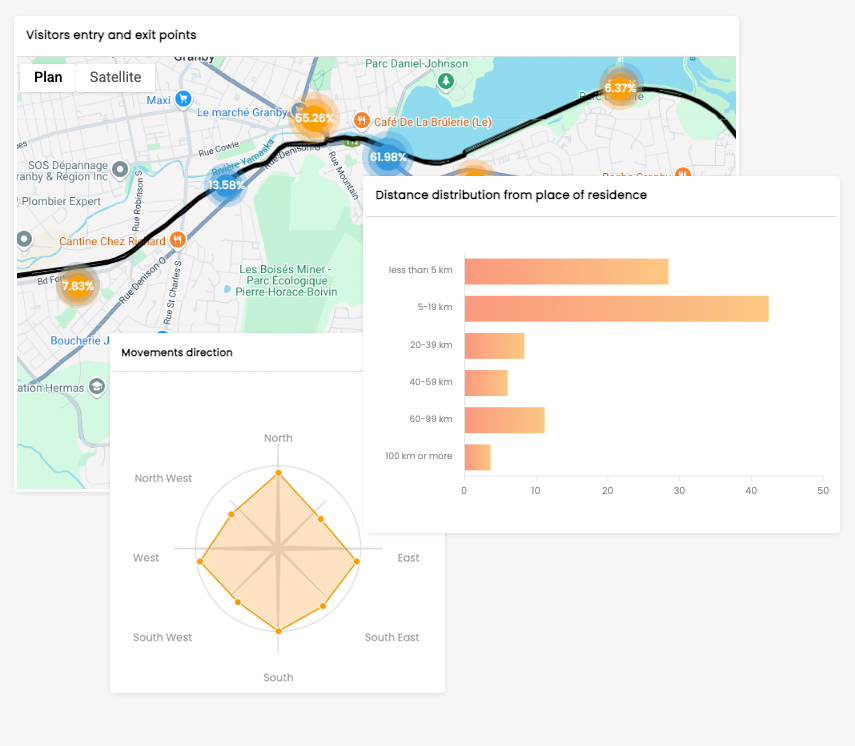
- Track movement direction and speed distribution – Identify the busiest sections and user behavior trends.
- Analyze entry and exit points – Improve access management and anticipate infrastructure needs.
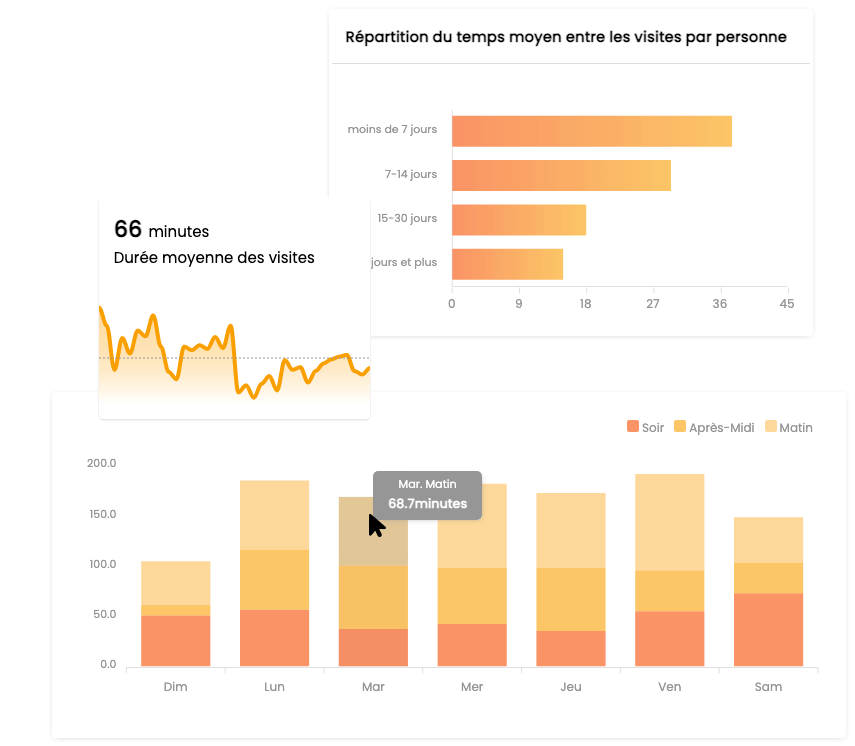
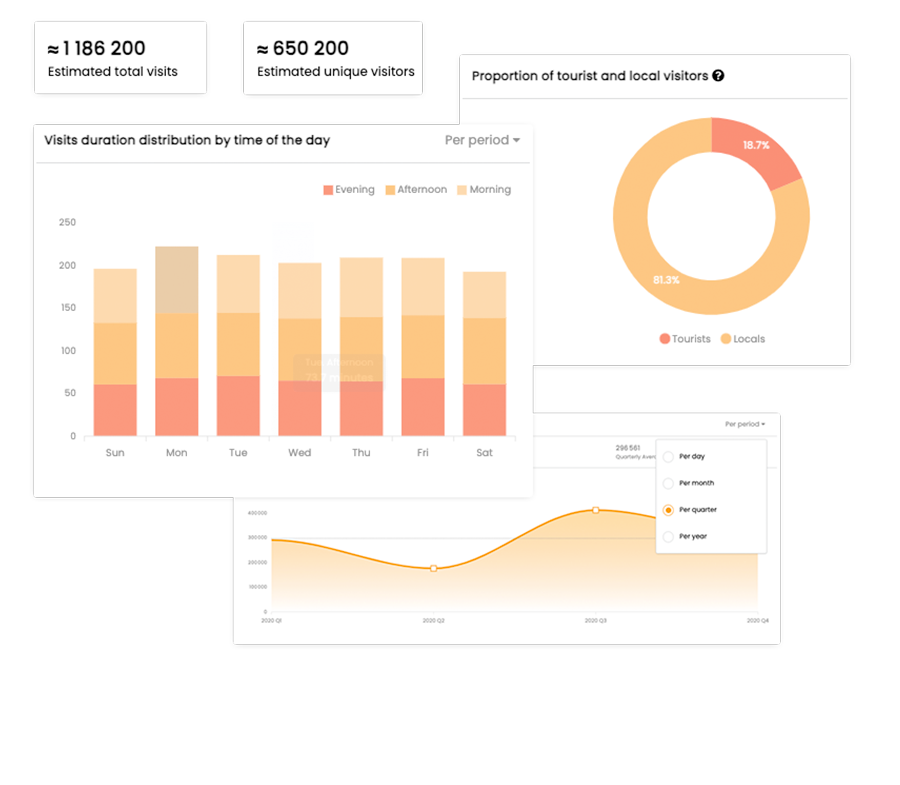
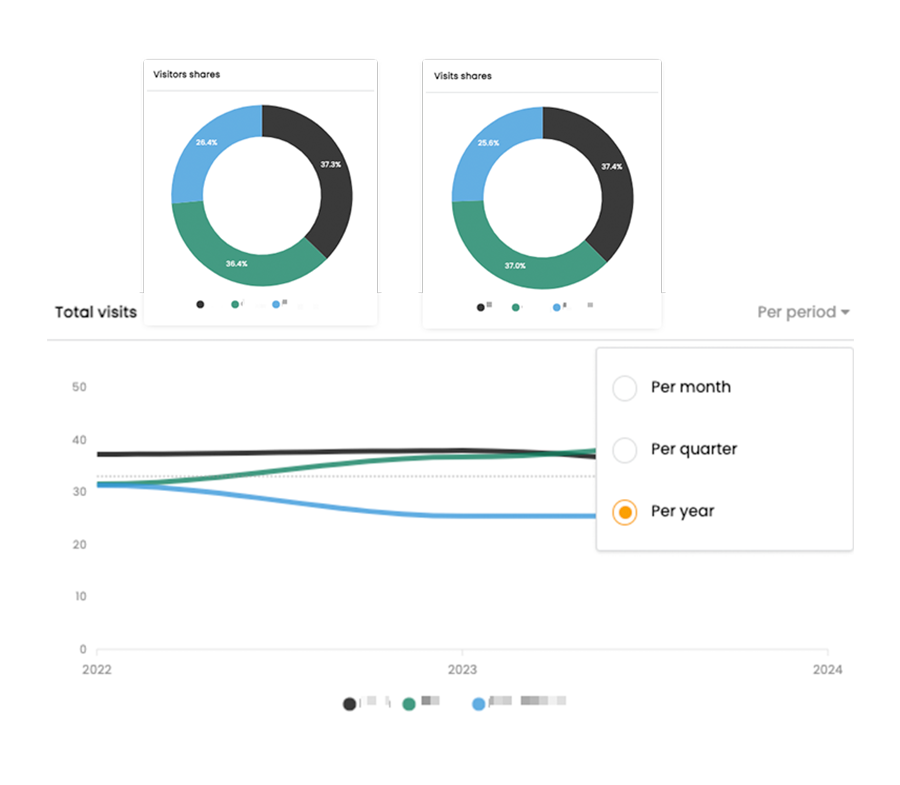
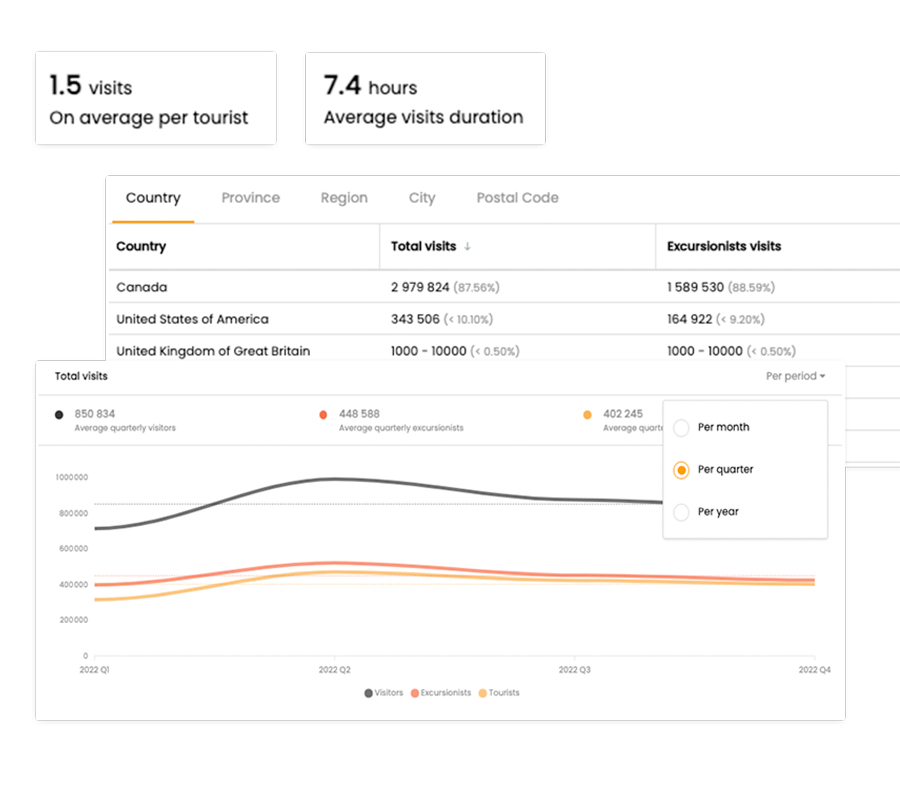
- Measure visit volume, average duration, and trends over time – Gain a clear picture of seasonal foot traffic and usage patterns.
- Monitor visit frequency per user – Distinguish between regular visitors and occasional users to tailor services accordingly.
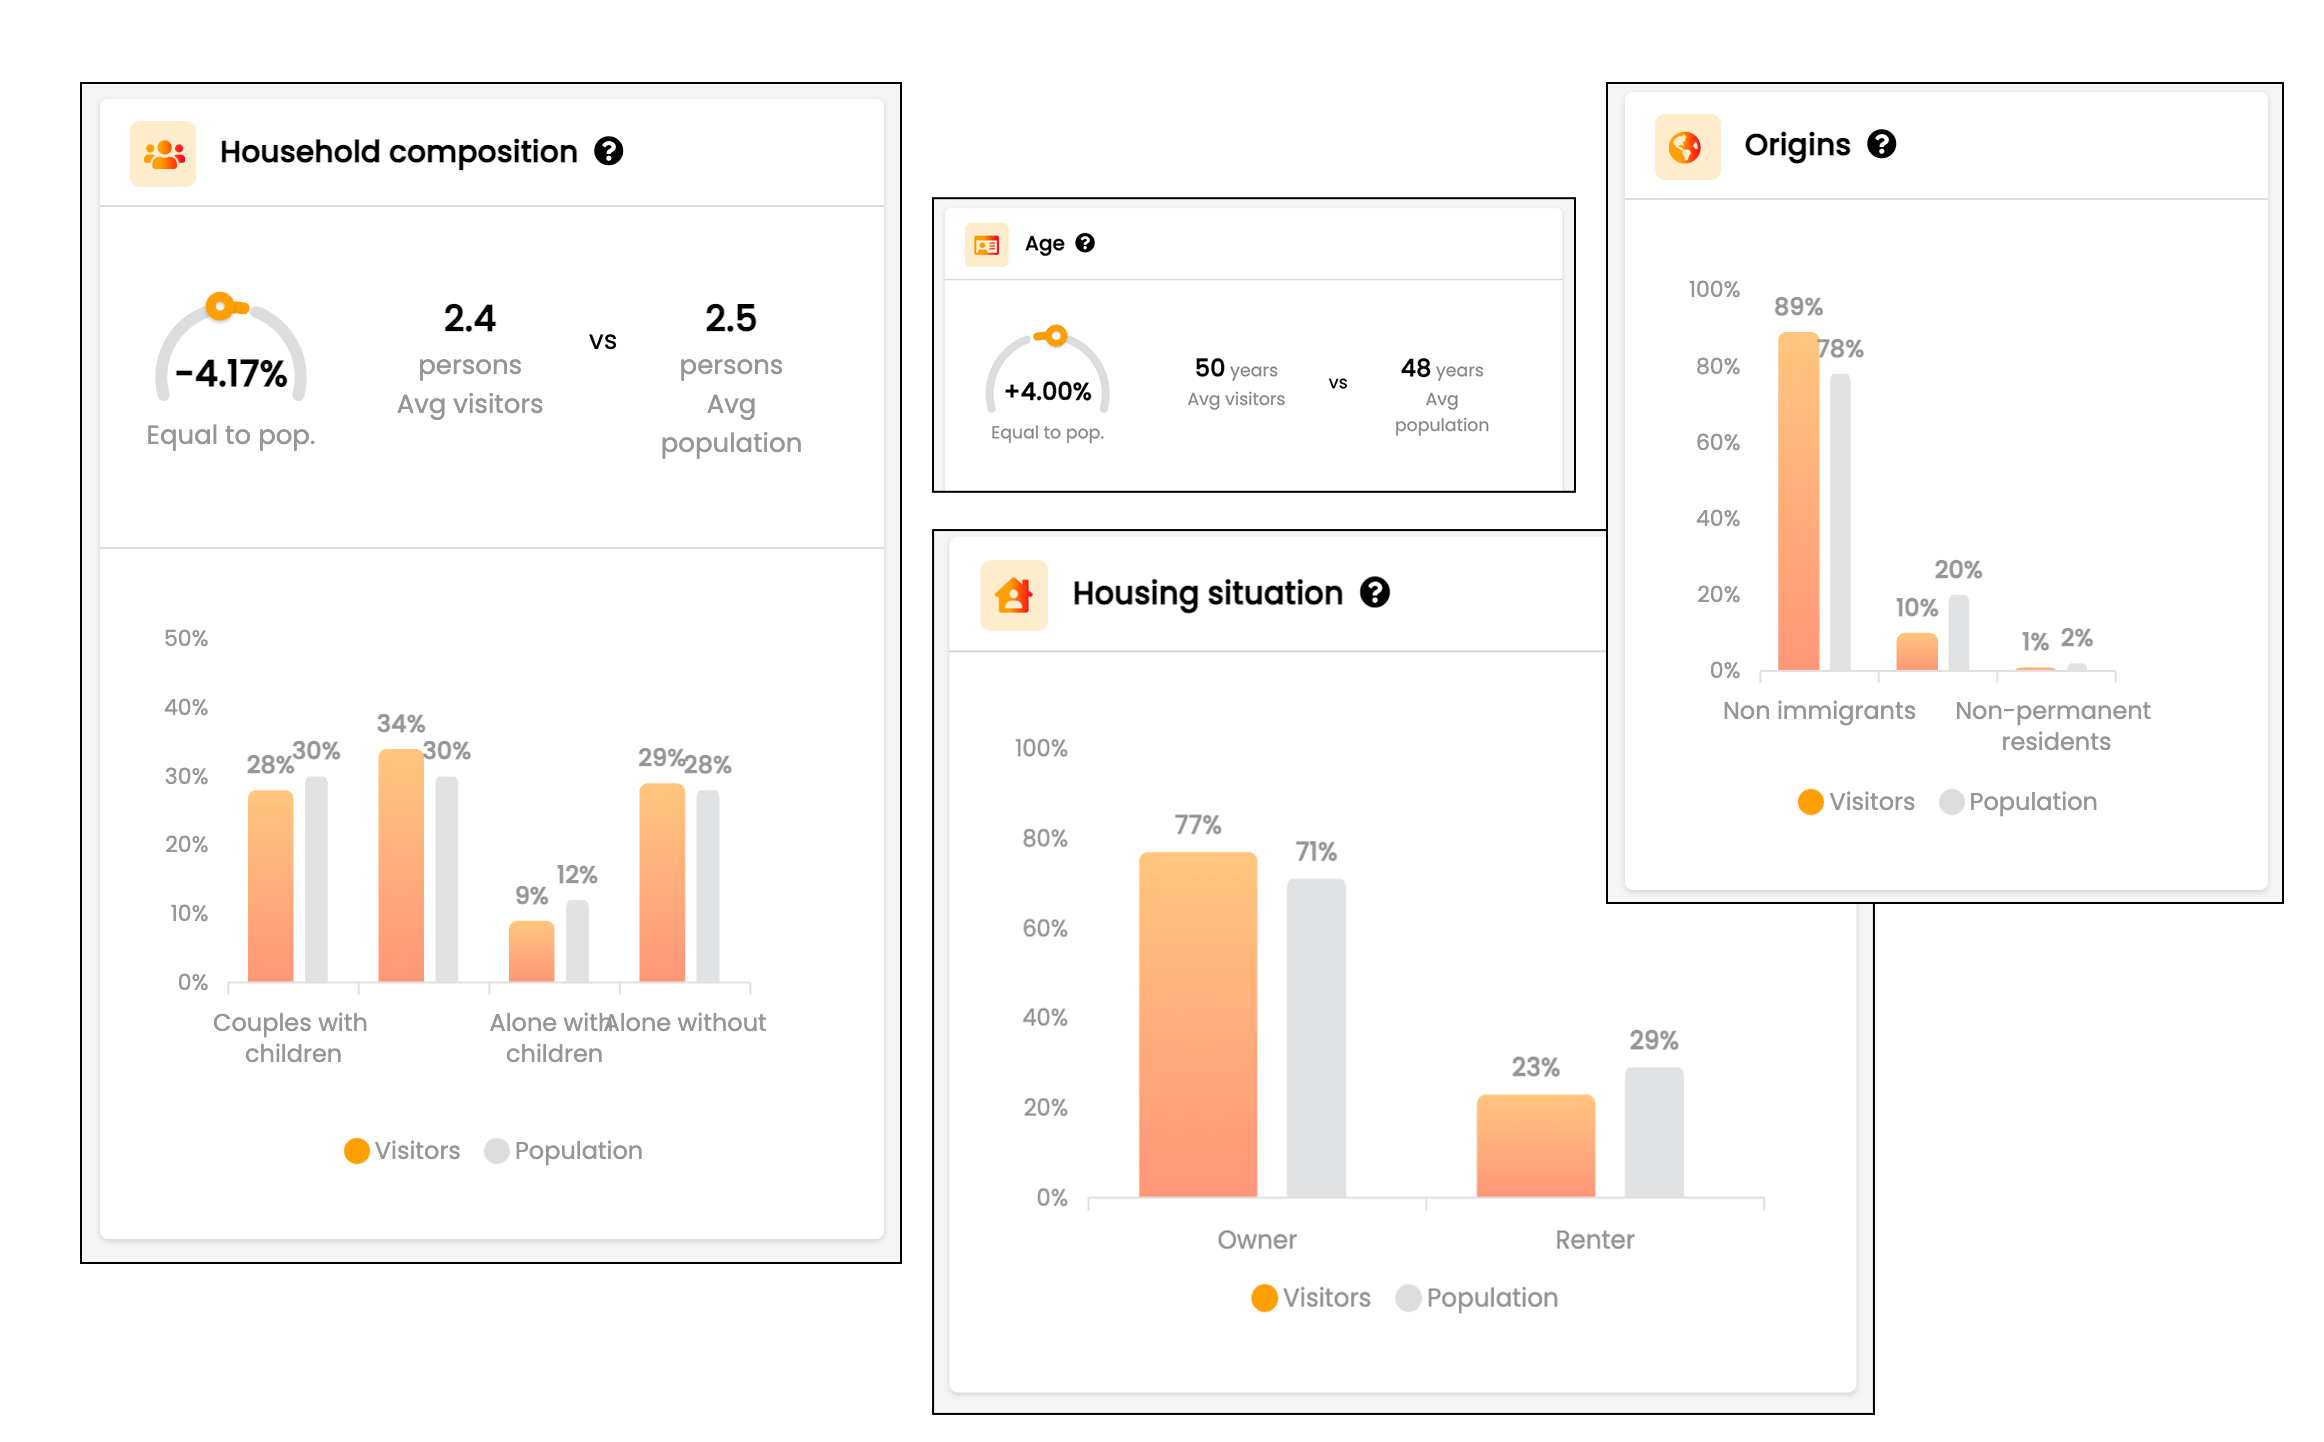
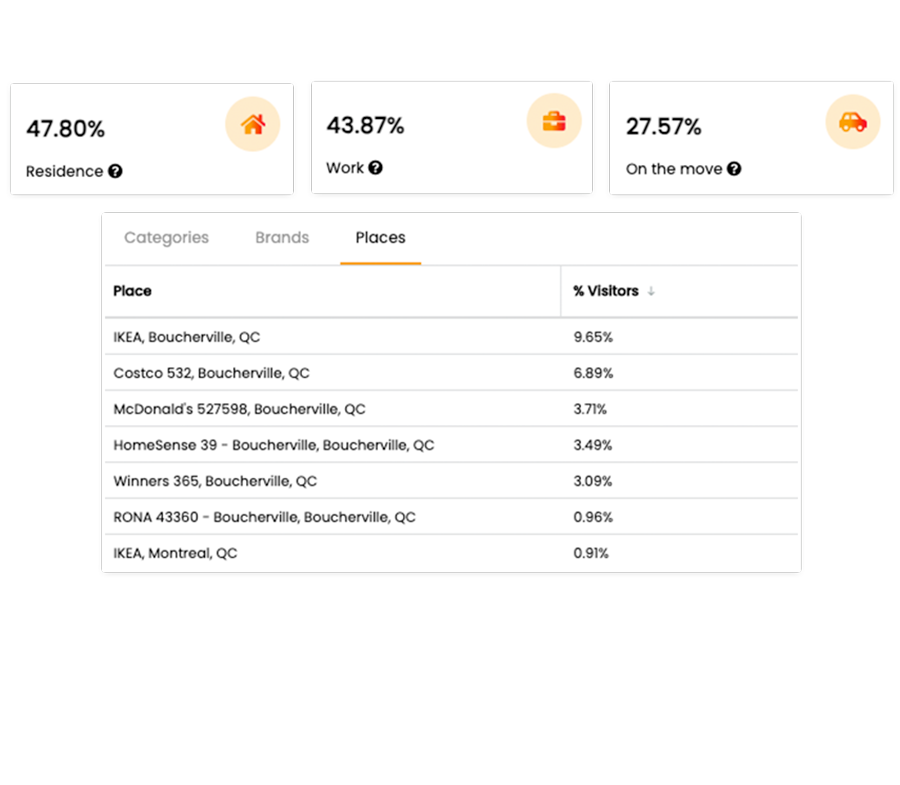
- Identify visitor origin – Better understand consumer behavior and refine targeted marketing campaigns.
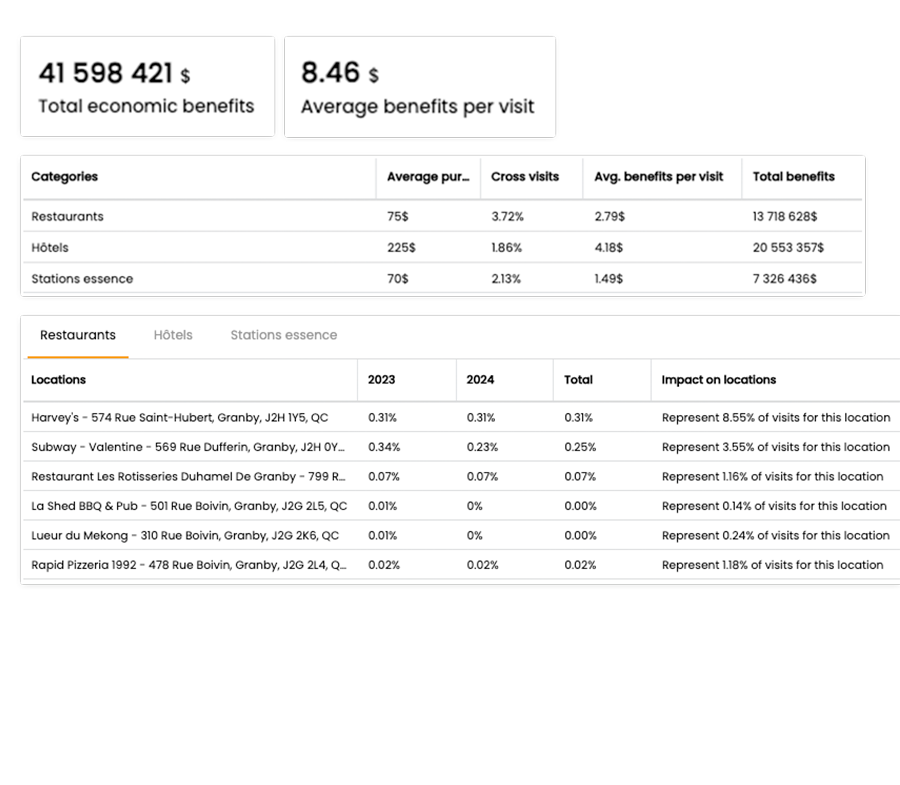
These detailed insights help trail managers, municipalities, and tourism organizations make informed decisions on planning, safety, and economic development.
Report developed in partnership with
Territorial Coverage
Available for Canada and United States
Duration (min. - max.)
3 to 12 months.

Sample Size
250 - 150 000 devices

Area Coverage
100 meter² to 10 km² (From 1,076.4 ft² to 107,639,104 ft²)
Economic Impact Report
Assess the economic impact of an attraction or sector using concrete data on visitor traffic and behavior. Our reports help you quantify financial returns and justify strategic decisions to stakeholders.
Our analysis enables you to:
- Measure visitor traffic and its evolution over time – Understand the attractiveness and performance of a location.
- Analyze cross-visits within the local economic ecosystem – Evaluate the impact on surrounding businesses.
- Estimate visitor spending – Gain a precise view of the economic benefits generated.
- Compare impact before and after a change in the offer – Assess the effectiveness of investments.
- Provide precise metrics for funding applications – Strengthen grant proposals and secure government support.
- Forecast economic trends related to visitor traffic – Adapt development strategies accordingly.
With real-world data-driven insights, make informed decisions to maximize economic impact in your region and demonstrate the value of your initiatives.

Territorial Coverage
Available for Canada and United States.
Duration (min. - max.)
3 to 12 months.
Sample Size
250 - 500 000 devices

Area Coverage
100 meter² to 10 km² (From 1,076.4 ft² to 107,639,104 ft²)

Affinity Report
Discover natural connections between brands and leverage these insights to refine your partnership, marketing, and expansion strategies. Propulso’s Affinity Report analyzes the likelihood of a customer visiting another brand compared to general population trends.
Our analysis enables you to:
- Identify affinities between brands and retailers by detecting shared visitation habits.
- Understand potential synergies to explore co-marketing or strategic expansion opportunities.
- Compare your visitors to market averages to adjust your offerings and better meet consumer expectations.
- Target advertising campaigns more effectively by focusing on audiences with complementary purchasing behaviors.
- Optimize your distribution network and partnerships based on real-world visitation affinities.
With these precise, actionable insights, maximize your growth opportunities and refine your strategic market positioning.
FAQ
-
What is the difference between Industry Reports, Unitary Reports, and Beta Reports?
Since the needs and parameters for analysis reports can be limitless, we have created predefined report templates that meet the majority of our clients' objectives. Two types of predefined reports are available on our platform : industry and unitary.
Industry ReportsSpecialized reports combining multiple unitary reports with a methodology adapted to the specific needs of an industry.
Ex. Tourism Report
Unitary ReportsSimple and versatile reports allowing customization and adaptation of the methodology for specific analysis.
Ex. Cross-Visits Report
Beta ReportsExploratory reports, whether individual or industry-based, provide raw, non-interfaced data files to support early-stage testing and validation of methodologies before full integration.
Since these reports are designed for experimentation rather than finalized analysis, detailed charts and structured documentation are not yet included. -
Where do you get the data?
The platform uses data from the mobile devices of consumers who have consented to having their information used for advertising purposes. This fully anonymous data (associated with an advertising ID) uses a combination of GPS, Wifi, Bluetooth and IP positioning information to pinpoint locations with a very small margin of error.
-
What countries allow use of the technology?
Currently, more than 100 countries allow geolocation-based advertising—including Canada, the United States, Mexico and several European countries.